January 24th, 2006
This site is served by an eight-year old, 300 MHz Pentium II, Debian Linux box in my home office. It works well enough for my needs. However recently the system has begin making occasional whining noises for intermittent periods. I’m afraid it’s on its last legs.
I had hoped to replace it with an Intel Mac Mini; but sadly that did not arrive at MacWorld, and seems unlikely to arrive before April 1 at the earliest. In the event I need to quickly replace this system, what do people recommend for small, quite, cheap, energy-efficient X86 box? Here are my requirements:
Read the rest of this entry »
Posted in Linux, Mac | 20 Comments »
January 23rd, 2006
“Basically, Flickr is what butters the borders between your photos to the people you want to see them.” http://www.flickr.com/learn_more.gne
Posted in Web Development | 1 Comment »
January 23rd, 2006
I picked up two more life birds yesterday on a Westchester trip with the Brooklyn Bird Club led by Peter Dorosh. The first was an Eastern Screech Owl that has been roosting in a tree in Croton Point State Park for a couple of weeks now.
Read the rest of this entry »
Posted in Birding | 3 Comments »
January 21st, 2006
George W. Bush is a criminal. He has blatantly broken the law in a major way. There is no reasonable doubt about this. He has admitted it. Apparently the lesson the Republicans learned from Watergate was that it’s not the crime that gets you. It’s the cover-up. As long as you freely admit that you broke the law, you have nothing to fear.
There seems to be little chance of him being tried, much less convicted for his crimes. Unlike our last president, he won’t be shamed into appointing a special prosecutor to investigate himself. Congress is in the hands of a dishonest and dishonorable Republican amen chorus that acts as if the only crime worth considering is a Democrat getting a blow job.
So here’s my question for the lawyers: is it possible for anyone else to indict and try the president? If the president has committed a federal crime (and he has) and Congress won’t act, does anyone else have jurisdiction? Can a federal prosecutor, a local district attorney, a low-level functionary in the Attorney General’s office, or anyone else indict and try the man? Is there a lawyer in the house?
Posted in Politics | 2 Comments »
January 15th, 2006
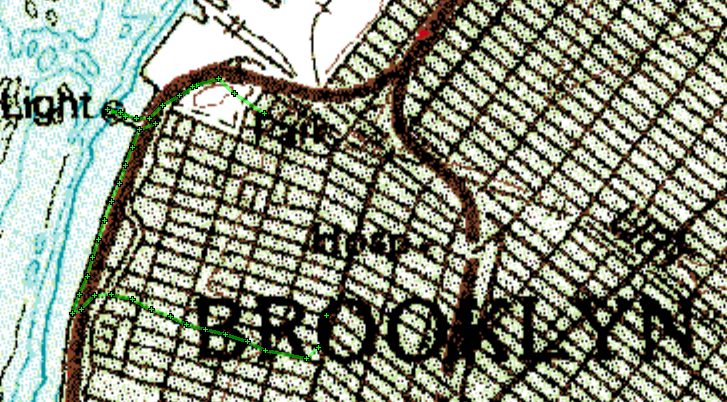
The track logs from my GPS unit look like this:
Format: DDD  M/D/Y H:M:S  -4.00 hrs  Datum[108]: WGS 84
ID	Date Time	Latitude	Longitude	Altitude
L	ACTIVE LOG
T	01/13/2006 14:15:56	40.63935	-74.02917	22.2
T	01/13/2006 14:18:57	40.64027	-74.03097	17.9
T	01/13/2006 14:20:36	40.64095	-74.03195	27.1
T	01/13/2006 14:22:53	40.64061	-74.03347	26.6
T	01/13/2006 14:26:08	40.64065	-74.03324	26.1
...
It occurred to me that someone must have integrated this with Google Maps and I was right. GPSVisualizer can convert these into a Google Map like this one:
Read the rest of this entry »
Posted in Tech, Web Development | 1 Comment »
January 15th, 2006
Friday I finished my scheduled work for the day a little early so I decided to head down to Owls Head Park in Bay Ridge. The rocks along the bicycle path that starts from there are often a good place to look for Purple Sandpipers, one of my target birds for the year.
Read the rest of this entry »
Posted in Birding | 2 Comments »